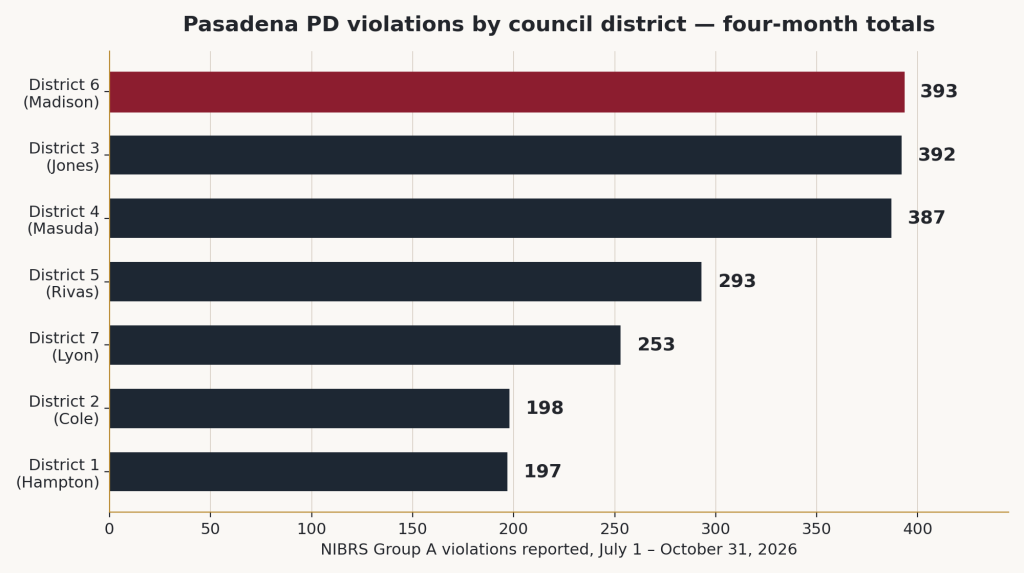
Featured image: AltaPasa chart of Pasadena PD’s district violation listing, July 1–October 31, 2026 (NIBRS Group A categories). Data: Pasadena Police Department, Crime Analysis Unit.
AltaPasa’s weekly police-calls posts count what comes in the door — roughly 2,000 calls for service a week. This is the other end of the pipeline: what the Pasadena Police Department actually recorded as violations. PPD’s Crime Analysis Unit has compiled a violation listing by council district for July 1 through October 31, 2026 (NIBRS Group A categories, dated November 9), and it is the clearest district-by-district crime picture the department publishes. Citywide, it records 2,113 violations over the four months.
Read the department’s own caveat first, because it matters: these are not the official figures PPD sends to the California Department of Justice each month (see the Pasadena PD website for those); a single incident can carry multiple violations; and the numbers are subject to change.
The districts, ranked
| District | Councilmember | Violations, Jul–Oct |
|---|---|---|
| District 6 | Steve Madison | 393 |
| District 3 | Justin Jones | 392 |
| District 4 | Gene Masuda | 387 |
| District 5 | Jess Rivas | 293 |
| District 7 | Jason Lyon | 253 |
| District 2 | Rick Cole | 198 |
| District 1 | Tyron Hampton | 197 |
Three districts — 6, 3 and 4 — account for 1,172 of the 2,113 violations, about 55 percent of the citywide total. The two lowest, Districts 1 and 2 in the north, sit at roughly half the leaders’ counts. Raw totals aren’t rates — districts differ in population, retail concentration and nightlife — but they show where recorded crime concentrates.
Theft is most of it
Add up the theft family and it is about 41 percent of everything recorded:
- Larceny (all other): 321 — the single largest category, led by District 6 (76)
- Shoplifting: 235 — District 4 alone recorded 80, a third of the citywide total; District 3 had 50
- Theft from vehicle: 121
- Burglary: 102 — District 6 highest at 27
- Theft of vehicle parts: 84 — District 4 led with 26 (the catalytic-converter pattern lives here)
- Motor vehicle theft: 65
Vandalism (203) and fraud categories — false pretense/swindle (82) and ID theft (51) — round out a picture dominated by property crime.
The violent-crime lines
Aggravated assaults totaled 119, concentrated in District 3 (30) and District 1 (23); simple assaults added 186. Robberies totaled 40, with Districts 3 and 5 recording 11 each. Two monthly movements deserve attention: aggravated assaults jumped to 40 in October, the highest month of the four, after easing to 16 in September — and half of District 1’s four-month aggravated-assault total (10 of 23) landed in October. Reported forcible rapes totaled 26, with 13 of them in October alone. Notably, no homicide violations appear in any district’s table for the four months. Drug-equipment violations (148) clustered in Districts 6 (39) and 5 (37); weapons violations totaled 28, led by District 4 (10); arson totaled 10, half of them in District 6.
The trend, and how to use these numbers
Citywide, the monthly count eased across the period — 586 in July, 521 in August, 506 in September, 500 in October. District 7 fell every month (73 → 48). District 1 moved the other way: its October total of 55 was its worst month. Treat this listing as a companion to our weekly Calls for Service coverage, not a replacement: calls measure demand on the department; violations measure what officers recorded. If something on your street needs reporting rather than reading about, the City Service Center takes service requests online and at (626) 744-7311, and Pasadena PD’s non-emergency line is (626) 744-4241.
Source: Pasadena Police Department, “Violation Listing by Council District — NIBRS Group A Categories,” reported July 1–October 31, 2026 (Crime Analysis Unit, Nov. 9, 2026) — the listing (PDF). District and category totals above are AltaPasa’s sums of the department’s tables; every district total was cross-checked against the printed totals.
